
After years of being a texture-only knitter (lace, cables, twisted stitches...) I have recently begun to delve into the world of stranded colourwork. I needed a way of turning photos and images into charts, to knit from. There is the handy KnitPro online application, which turns an uploaded image into a charted PDF ready to be used. Very useful, but it occurred to me that, instead of editing my images and then saving them and then uploading them into KnitPro and THEN getting the charted PDF, there might be a way of generating the chart right after editing - in the image editing program itself. The program I use is GIMP (a truly brilliant - and free! - image editing program, on a par with Photoshop). I'm going to assume in this tutorial that you have a very basic working knowledge of GIMP, but even if you don't, I think you will be able to follow this, as long as you can find basic tools like Crop and Select on your own.

This is the image I'm going to turn into a chart:
[Note that this is obviously a very detailed image and would need a large "resolution" of knitted "pixels" to show sufficient detail in the finished object... in other words, the more rows and sts you use for the image, the bigger and more detailed it will be. I probably wouldn't opt to turn an image like this into stranded colourwork, just because of the sheer size of the thing, but it was the first thing I came across to use as an example. A better sort of image to start with would be something slightly less detailed, with clearer lines - a good quality line drawing, for example. (This is a photograph of an ink-stamp from a hand-carved rubber stamp that I made myself).]

First things first, I open the image in GIMP, crop all the unnecessary bits around the edge out, and then desaturate the image by going to Colours > Desaturate and clicking OK.

This turns the image entirely grayscale. Next, I'll resize the image so that each pixel corresponds to a single knitted stitch or row... for example, I want this to be 100 rows high, so I go to Image > Scale Image...

... and in the dialogue box that comes up, I type in 100 pixels for the height:
See the little chain icon next to the height and width boxes? When the chain is linked together it means that if you enter a number for height (or width), the number for width (or height) will change automatically to preserve the aspect ratio. If you click the chain so it's unlinked, you can enter unrelated values for width and height, and so change the aspect ratio of the image, if you want to.
"Why would I want to do that?" I hear you cry.
The answer (as so often is the case with knitting) is "GAUGE!"
If you have square gauge (i.e., 24 sts to 24 rows over 4 inches square), and you put a square grid on top of your image, everything works out fine. If, however, your gauge is not square and you put a square grid on top of your image, you're going to end up with a slightly wonky looking image. The trick, I have found, is to distort your image in the opposite direction to your gauge before overlaying the square grid. You need to do a bit of maths, work out the percentages, and then apply them here (in GIMP you can change sizes based on percentages, as well as pixels and other measurements).
However, I'm getting ahead of myself. For the purposes of this example, we'll assume gauge is square (as it often tends to be in stranded colourwork). This means we can just scale down the image to the height and width we want, without changing the aspect ratio.

So, I've scaled my image to height 100 x width 99 and this is what it looks like when I zoom back in:

It needs to be sharpened up into only black and white pixels, no grey. To do this, I go to Colours > Threshold:
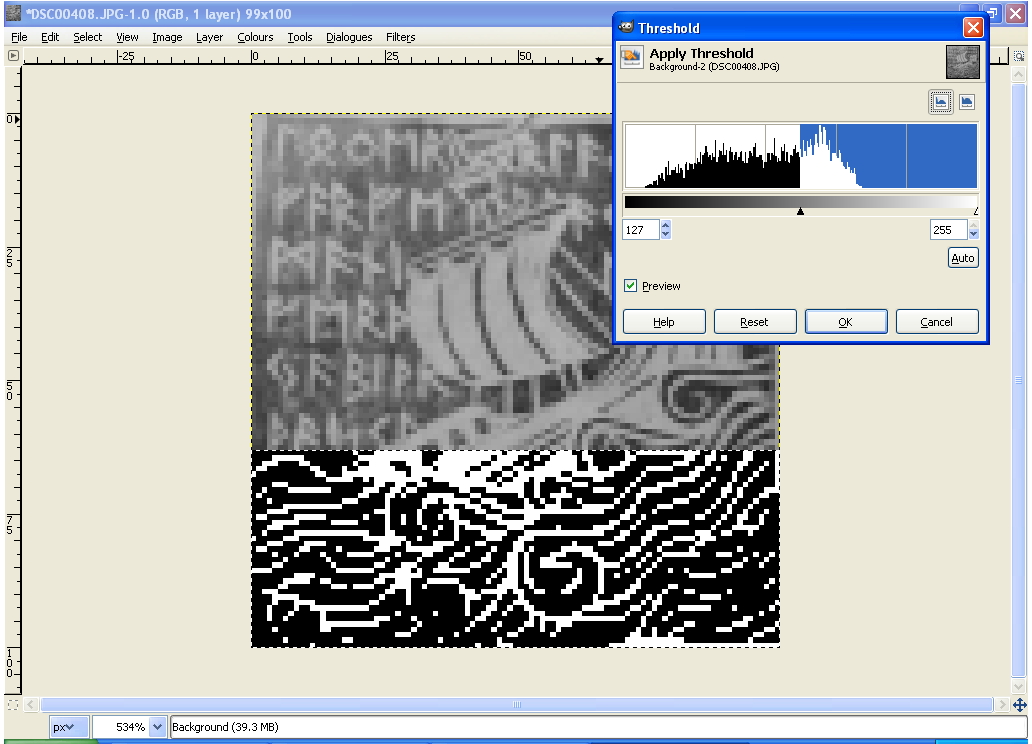
Usually the setting it comes up with to begin with is the best to use, but you can play around by dragging the little black and white arrows. As you can see in this example, if the original image is a photo or scan, you will most likely have areas that respond differently to the threshold levels (see the whited-out bit at the top left hand corner?). If this is the case, it's useful to know that you can select different areas and work separately on one bit at a time. I used the square select tool to do this:

... and after a bit of fiddling, this is what I have (not perfect... but not bad either!):
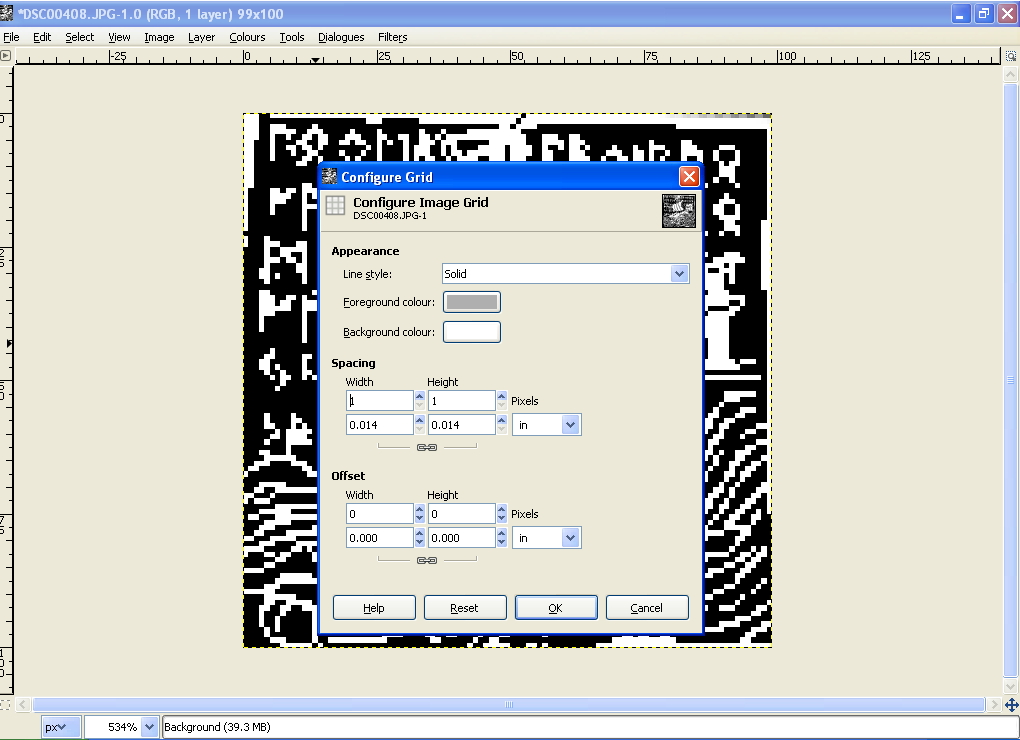
Now to add the grid. Go to Image > Configure Grid. I like to set my grid with Line Style: Solid and Foreground Colour: Grey. Most importantly - set the spacing to Width: 1 pixel and Height: 1 pixel.

And finally - go to View > Show Grid:

There we have it - a colourwork chart ready to knit from:

Here's a little close up detail:
One last thing - you can't save the image or print it with the grid visible (at least, I haven't found a way of doing it in GIMP... someone let me know if I'm wrong!). There's an easy way around this though. Simply get the image with the grid at a nice zoom level so that the whole image fills the screen. Then hit the "Print Screen" key on your keyboard. This grabs a screen capture and copies it to the clipboard. Now all you have to do is open a new file in GIMP and press Ctrl + V. This will paste the screenshot in. You can crop the edges off, and save your chart as a JPG (or whatever else you like). And then print and knit to your heart's content!
I hope this tutorial was easy to follow, and that it was helpful to someone out there. If someone creates a lovely stranded (or intarsia!) project using the methods in this tutorial, please let me know, I'd love to see it!